The survey ran from November 16th to December 16th 2022.
143 people answered the questions (partially or completely).
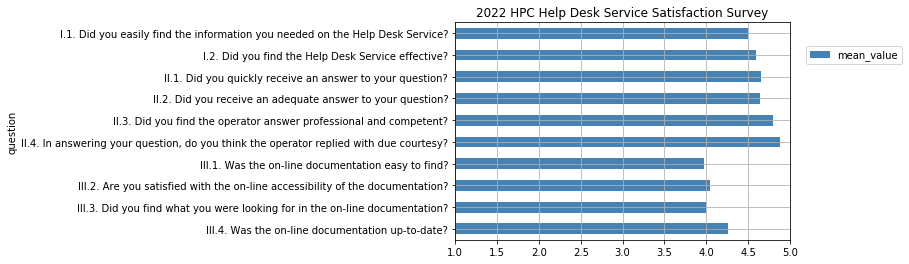
In the following chart the average marks for the questions in the survey are shown - 1 to 5 - for lowest to highest level of satisfaction:
We thank all participants for their suggestions and comments that will help us to improve the quality of the Help Desk service