In this page:
Basic concepts
The interactive computing service provides an alternative approach to computational resources. The service is accessible via a web browser, with an extended Jupyterlab interface based on the Gaia suite developed by E4 analytics.
The resources requested through the browser interface are allocated on a dedicated set of nodes, all of which are equipped with GPUs. These GPUs are not shared among users, and their allocation is exclusively granted upon request. On the other hand, the allocated CPUs can be shared if the system is fully utilized. This allows for near-immediate access to the system without waiting time. Once the resources are allocated, the browser session can be closed and quickly restored by accessing the service URL.
At the moment the service is available on Galileo100.
PLEASE NOTE: the service starts in pre-production phase on June 29th, meaning all the resources are provided with no warranty. In such a pre-production phase the accounting is disabled.
How to get access
Every user with computational resources on the cluster hosting the service can access to it.
The service can be reached thought the following web address: https://jupyter.g100.cineca.it
Requested resources and releases
At the opening page, the user will be asked to login with the CINECA cluster credentials.
After the login, the system prompts the user to a form where he/she can request the resources needed during the interactive session.
The form appears as follow

In the form, in analogy to a sbatch SLURM script on cluster login nodes, the user has to select:
- Slurm reservation: you can leave it to "None" unless you are assigned to some specific reservation;
- Slurm account: the active account you want to be billed for the session; please note that during the pre-production phase, the accounting is inactive.
- Number of cores: the number of cores requested for the interactive computing session; please note that cores are assigned in over-subscription, which means that in the unlucky scenario in which all the cores of the system are allocated, the user may share the same core with other users (currently maximum five users on the same CPU);
- Memory: the amount of RAM memory requested for the session;
- GPU configuration: the number of GPUs which the user requests; differently from CPUs, they are not shared among users and are assigned exclusively; the number of GPUs is limited, thus please be careful to release the resources you requested when you finish your work (see the session "Logout vs Session shutdown" here below) to let the other users to use them. You can check the availability of resources, in particular GPU ones, by looking at the table at the bottom of the page, wherein each row is displayed the number of nodes with no free GPUs, the ones with a single free GPU and the ones with both the GPUs available;
- Time: the wall time of your interactive session; during this time, you can close and reopen your browser tab/windows with no issues: the session will stay active, and you can re-attach it simply by accessing to the Interactive Computing web url once again;
- ICE4HPC Backend environment: the suite of tools you expect to find during the session execution; see "Tools and functionalities" section for details;
- User interface: only the Jupyterlab interface is available so far, so please ignore this menu for now;
Once you have filled out the form with your preferred parameters, click the "Start" button at the bottom. This action will redirect you to the JupyterLab interface, which runs on the cluster's compute nodes where the user can select the tool or functionality among the available.
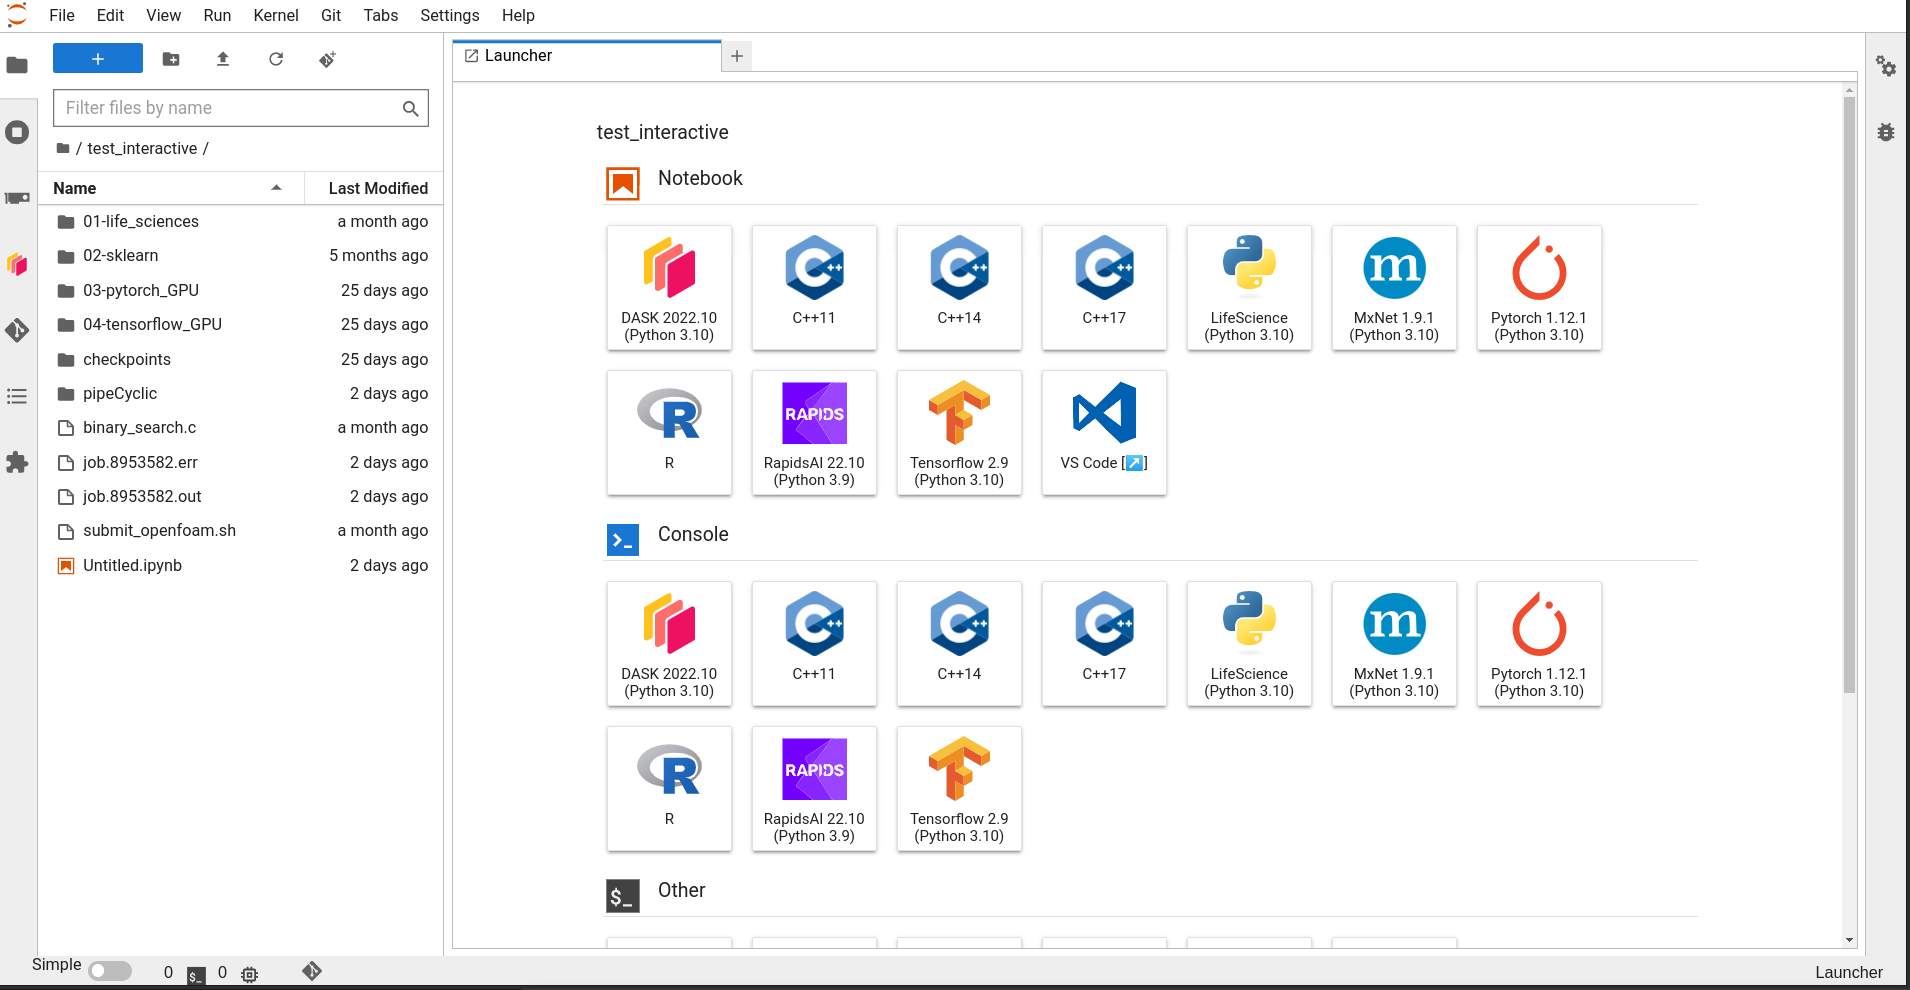
Tools and functionalities
The tools you will see in the Jupyterlab interface are "packed" in releases: each tool in each release is pinned at the same version to guarantee compatibility. It is possible to choose the release in the initial form displayed after the login phase: in the drop-down menu, they are labelled with a release date, thus the more the date is recent, the more the tool versions are updated, so as a rule of thumb, you might want to test the most recent release with your code.
Currently, the following services are up and running on the interface displayed after your session starts:
Python environments
Several Python environments are provided by default. You can see below the list of them with the versions of the main package:
Release 2023.10
- Python: python 3.11.6
- Dask: dask 2023.09.3, python 3.11.6
- Tensorflow: tensorflow 2.12.1, python 3.11.6
- Pytorch: pytorch 2.11.0, python 3.11.6
- Rapids: rapids 23.10.00, python 3.10.13
- MXnet: mxnet-cu112 1.9.1, python 3.11.6
- MDanalysis: mdanalysis 2.6.1, python 3.10.6
Release 2022.10
- Python: python 3.10
- Dask: dask 2022.10.0, python 3.10
- Tensorflow: tensorflow 2.9.1, python 3.10.6
- Pytorch: pytorch 1.12.1, python 3.10.6
- Rapids: rapids 22.10, python 3.9
- MXnet: mxnet 1.9.1, python 3.10.6
- MDanalysis: mdanalysis 2.4.2, python 3.10.6
You can obtain the complete list inside the environment by running `!mamba list` in a Jupyter notebook (after selecting the corresponding kernel in the top-right menu).
You can also add your custom environments, as described in the section "User custom Python environments".
C/C++ kernel
C/C++ kernel implementation is based on Xeus; you can use C/C++ instructions inline, like with Jupyter notebooks. You can check the Xeus documentation here.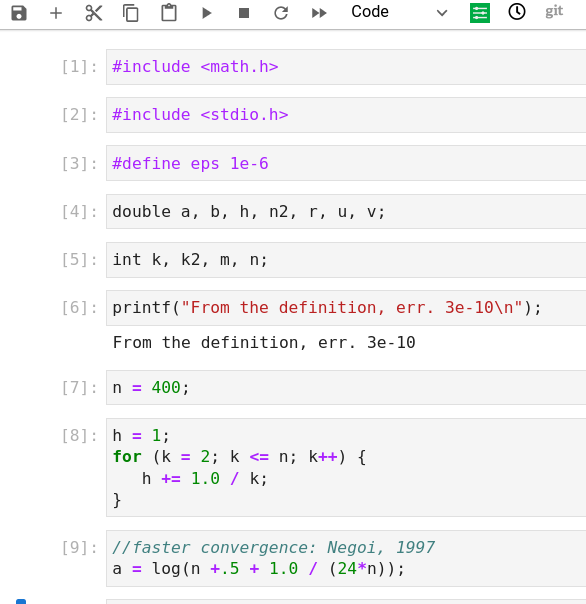
Visual Studio Code
Visual Studio Code (VSCode) is a very common code editor developed by Microsoft, which offers many advanced features for programming. You can find some tutorials for beginners in the official documentation.
From the interactive Computing interface, you can see a VSCode entry in the launcher after you have started the session; clicking on the VSCode, a new tab/window (depending on your browser settings) will be opened with a web interface containing the VSCode. You can work with VSCode as long as your Jupyterlab session is running and your resources are allocated; to stop your session in advance and release the resources, you need to stop the Jupyterlab session in the original tab: see "Logout vs Session Shutdown" section for details.
Slurm Queue Manager
In this web interface, the user can make use of the standard compute node partitions of the Slurm scheduler by:
- submitting new jobs from existing Slurm scripts examples
- monitoring and managing Slurm jobs running on the cluster
- writing new Slurm scripts and submitting them
You can only submit/monitor/manage jobs on the partitions of the same cluster where the Jupyter service is hosted.
This interface is based on the jupyterlab-slurm plugin developed by NERSC; you can find the official documentation here.
Monitoring tools
On the (very) left side of your dashboard there is a vertical menu, which allows the user to access some additional functions; one of the buttons is called "GPU Dashboards". From here, you can monitor your resources usage in real-time, in particular:
- In the "Machine Resources" section, you can monitor CPUs, memory utilization, and network and I/O bandwidth.
- If you requested GPUs from the initial form, you would see several additional menu to monitor, for instance, GPUs utilization, memory bandwidth and occupation, PCI throughput.

The dashboard is developed by nVidia with the jupyterlab-nvdashboard plugin.
User custom Python environments
You can create your own customized Python environment and display them on the Jupyter launcher.
You can proceed as follows:
- open a terminal from your launcher
in this terminal a conda instance is already active, specific for the release you chose at the login phase (see section "Requested resources and releases"), thus you can run the commands below:
source $CONDA_PREFIX/etc/profile.d/conda.sh  					# be careful to run it in a new terminal with no other environments activated conda
conda init bash
conda create -n <your_environment_name> ipykernel
conda activate <your_environment_name>
conda install <python_packages_to_be_installed>
python -m ipykernel install --user --name <your_environment_name> --display-name <name_to_be_displayed_in_the_launcher>
- A new environment will now appear in the launcher of the dashboard (N.B. you might need to refresh the page); the new kernel is also listed in the drop-down menu of every new Jupyter notebook so that you can use the packages you installed when you created the environment.
- If you need to delete the environment from your launcher, you can click on Terminal in your Jupyter launcher and run the following commands:
(optional: delete the environment from your home directory):
source $CONDA_PREFIX/etc/profile.d/conda.sh  # be careful to run it in a new terminal with no other environments activated
conda remove --name <your_environment_name> --all
- (remove kernel from Jupyter launcher)
jupyter kernelspec uninstall <your_environment_name>
You can also further customize your kernels running specific bash script along with your custom Python environments; for instance, after the procedure described so far, a new json file is created in your home in the following path:
$HOME/.local/share/jupyter/kernels/<your_environment_name>/kernel.json
whose content is similar to the following:
{
 "argv": [
  "<your_home_directory_path>/.conda/envs/<your_environment_name>/bin/python",
  "-m",
  "ipykernel_launcher",
  "-f",
  "{connection_file}"
 ],
 "display_name": "<name_to_be_displayed_in_the_launcher>",
 "language": "python",
 "metadata": {
  "debugger": true
 }
}
This JSON file describes what Jupyterlab runs when clicking on the related button in the launcher page; you can create a bash script to be added in this JSON file to be properly run before your environment execution; this allows for instance, to load any module from the cluster and make it visible during your Python environment execution.
For instance, in the following example, we create a file called wrapper.sh in the same folder of the JSON file (you can choose the path and the name you prefer):
- click on Terminal on your launcher;
move inside the folder you want and open a new file (e.g.
wrapper.shusing vim or nano or emacs)cd $HOME/.local/share/jupyter/kernels/<your_environment_name> nano wrapper.sh
You need to write a bash script as the following:
#!/bin/bash
### You can add here whatever bash commands you like, like for example, "module load" commands

module load <your_first_module>
module load <your_second_module>

### Remember the next line!
exec "$@"
Make this file executable:
chmod +x wrapper.sh
Edit your
kernel.jsonfile (e.g. nanokernel.json) by adding the following line"<your_home_directory_path>/.local/share/jupyter/kernels/<your_environment_name>/wrapper.sh",
as the first entry in your
argvJSON field; in the end, your file should look like the following:{ "argv": [ "<your_home_directory_path>/.local/share/jupyter/kernels/<your_environment_name>/wrapper.sh", "<your_home_directory_path>/.conda/envs/<your_environment_name>/bin/python", "-m", "ipykernel_launcher", "-f", "{connection_file}" ], "display_name": "<name_to_be_displayed_in_the_launcher>", "language": "python", "metadata": { "debugger": true } }- Now all the bash commands (and variables) you added inside
wrapper.share visible by the Python kernel of your environment. You can check it by running bash commands directly from your Python environment in Jupyter notebooks using your kernel (N.B bash commands can be run from Jupyter notebooks/consoles using "!" at the beginning of the line)
Access to work and scratch areas
In the left column of the principal page, you can see the content of your HOME area on the cluster.
Your WORK and SCRATCH areas are not visible from your default Interactive Computing interface. To make them visible and reachable, you need to create a symbolic link in your HOME directory pointing those areas. In the following example, we are creating a link to the SCRATCH area and a link to the WORK area inside our home directory by launching the following commands in a terminal on the cluster:
ln -s $CINECA_SCRATCH $HOME/scratch
ln -s $WORK $HOME/work
Thus now we can see a work and a scratch icons in the file manager on the left side of our interface, and we can access them.
We strongly suggest creating such links to make all the storage available to the Interactive computing sessions (and not just the home storage).
Please remember that the $WORK variable refers to the work area of your current default account, so you should create different links for different accounts and keep them updated over time.
Logout vs Session shutdown
By default, your session is not shut down when you close your browser window (or tab); as long as the session is active (until the walltime is reached), the requested resources are not released to other users. In this way, by opening a new browser, the user can restore a still active session simply by re-accessing the Interactive Computing URL. Until the session is finished by reaching the walltime or closed manually by the user, the requested resources will be billed on the budget account indicated by the user in the form.
If you have finished and you want to close your session manually you need to click on File, then select "Hub Control Panel" and finally "Stop my server".


Troubleshooting
"Kernel died unexpectedly" error message.
Unfortunately, Jupyter kernels are not very verbose, but in many cases, this error can be related to a buffer overflow; please consider testing the code once again in a new session (see "Logout vs Session shutdown") requesting a larger amount of memory.
Spawning job message hangs after requesting resources.
The problem might occur when requesting an unavailable amount of resources, which might be the case of jobs requesting GPUs; you can take a look to the table in the bottom of the form for resources allocation, which lists all the nodes available with zero, one or two GPUs; if you requested, for instance, a session with 2 GPUs but there are no nodes with 2 GPUs currently available, then this issue might occur. Please consider to fit your requests to the available resources to have the session starts in short time.