...
This system will be in production at the beginning of 2020 as an upgrade of the "non conventional" partition of the Marconi Tier-0 system. It is an accelerated cluster based on Power9 chips and Volta NVIDIA GPUs, acquired by Cineca within the PPI4HPC European initiative.
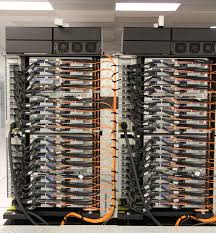
System Architecture
Architecture: IBM Power 9 AC922
Internal Network: Mellanox Infiniband EDR DragonFly+
Storage: 8 PB (raw) GPFS of local storage
...
Model: IBM Power AC922 (Whiterspoon) Racks: 55 total (49 compute) |
|
|---|
Access
All the login nodes have an identical environment and can be reached with SSH (Secure Shell) protocol using the "collective" hostname:
...
For information about data transfer from other computers please follow the instructions and caveats on the dedicated section Data storage, or the document Data Management.
Accounting
For accounting information please consult our dedicated section.
...
Please note that the accounting of the consumed core hours takes into account the requested memory and number of GPUs, please refer to the dedicated section.
Budget Linearization policy
On M100 a linearization policy for the usage of project budgets has been defined and implemented. For each account, a monthly quota is defined as:
...
This policy is similar to those already applied by other important HPC centers in Europe and worldwide. The goal is to improve the response time, giving users the opportunity of using the cpu hours assigned to their project in relation of their actual size (total amount of core-hours).
Disks and Filesystems
The storage organization conforms to the CINECA infrastructure (see Section Data Storage and Filesystems).
...
Since all the filesystems are based on IBM Spectrum Scale™ file system (formerly GPFS), the usual unix command "quota" is not working. Use the local command cindata to query for disk usage and quota ("cindata -h" for help):
> cindata
GPU and intra/inter connection environment
Marconi100 login and compute nodes host four Tesla Volta (V100) GPUs per node (CUDA compute capability 7.0). The most recent versions of nVIDIA CUDA toolkit and of the Community Edition PGI compilers (supporting CUDA Fortran) is available in the module environment, together with a set of GPU-enabled libraries, applications and tools.
...
nVIDIA GPUDirect technology is fully supported (shared memory, peer-to-peer, RDMA, async), enabling the use of CUDA-aware MPI.
Modules environment
As usual, the software modules are collected in different profiles and organized by functional category (compilers, libraries, tools, applications,..).
...
In order to detect all profiles, categories and modules available on M100 the command “modmap” is available:
>modmap
Spack
...
Production environment
Since M100 is a general purpose system and it is used by several users at the same time, long production jobs must be submitted using a queuing system. This guarantees that the access to the resources is as fair as possible.
Roughly speaking, there are two different modes to use an HPC system: Interactive and Batch. For a general discussion see the section Production Environment and Tools.
...
Since a physical core (4 HTs) is assigned to one task, a maximum of 32 tasks per node can be asked (--ntasks-per-node), corresponding (as mentioned) to receive 4 logical cpus per task.
Interactive
A serial program can be executed in the standard UNIX way:
...
For all the mentioned cases, SLURM automatically exports the environment variables you defined in the source shell, so that if you need to run your program "myprogram" in a controlled environment (i.e. specific library paths or options), you can prepare the environment in the origin shell being sure to find it in the interactive shell (started with both srun and salloc).
Batch
As usual on systems using SLURM, you can submit a script script.x using the command:
...
For more information and examples of job scripts, see section Batch Scheduler SLURM.
Submitting serial Batch jobs
The m100_all_serial partition is available with a maximum walltime of 4 hours, 1 task and 7600 MB per job. It runs on two dedicated nodes (equipped with 4 Volta GPUs), and it is designed for pre/post-processing serial analysis (using or not the GPUs), and for moving your data (via rsync, scp etc.) in case more than 10 minutes are required to complete the data transfer. This is the default partition, which is assumed by SLURM if you do not explicit request a partition with the flag "--partition" or "-p". You can however explicitly request it in your batch script with the directive:
#SBATCH -p m100_all_serial
Submitting Batch jobs for production
Not all of the partitions are open to access by the academic community as some are reserved to dedicated classes of users (for example *_fua_ * partitions are for EUROfusion users):
...
This QOS is automatically associated to Eurofusion users once their projects exhaust the budget before their expiry date. For all the other users, please ask superc@cineca.it to request the QOS association.
Summary
In the following table you can find all the main features and limits imposed on the queues/Partitions of M100.
...
SLURM partition | Job QOS | # cores/# GPU per job | max walltime | max running jobs per user/ max n. of cpus/nodes/GPUs per user | max memory per node (MB) | priority | notes |
m100_all_serial (default partition) | normal | max = 1 core, 1 GPU (max mem= 7600 MB) | 04:00:00 | 4 cpus/1 GPU | - | 40 | |
| m100_usr_prod | m100_qos_dbg | max = 2 nodes | 02:00:00 | 2 nodes/64 cpus/8 GPUs | 246000 | 45 | runs on 12 nodes #SBATCH -p m100_usr_prod #SBATCH --qos=m100_qos_dbg |
| m100_usr_prod | normal | max = 16 nodes | 24:00:00 | 10 jobs | 246000 | 40 | runs on 880 nodes #SBATCH -p m100_usr_prod |
| m100_qos_bprod | min = 17 nodes max = 256 nodes | 24:00:00 | 256 nodes | 246000 | 85 | runs on 256 nodes #SBATCH -p m100_usr_prod #SBATCH --qos=m100_qos_bprod | |
| m100_fua_prod | m100_qos_fuadbg | max = 2 nodes | 02:00:00 | 246000 | 45 | runs on 12 nodes #SBATCH -p m100_fua_prod #SBATCH --qos=m100_qos_fuadbg | |
| m100_fua_prod | normal | max = 16 nodes | 1-00:00:00 | 246000 | 40 | runs on 68 nodes #SBATCH -p m100_fua_prod | |
| qos_special | >256 nodes | >24:00:00 | 246000 | 40 | #SBATCH --qos=qos_special request to superc@cineca.it | ||
| qos_lowprio | max = 16 nodes | 24:00:00 | 246000 | 0 | #SBATCH --qos=qos_lowprio Non-Eurofusion users: request to superc@cineca.it |
Graphic session
If a graphic session is desired we recommend to use the tool RCM (Remote Connection Manager). For additional information visit Remote Visualization section on our User Guide.
Programming environment
The programming environment of the M100 cluster consists of a choice of compilers for the main scientific languages (Fortran, C and C++), debuggers to help users in finding bugs and errors in the codes, profilers to help in code optimisation.
...
If you use a given set of compilers and libraries to create your executable, very probably you have to define the same "environment" when you want to run it. This is because, since by default linking is dynamic on Linux systems, at runtime the application will need the compiler shared libraries as well as other proprietary libraries. This means that you have to specify "module load" for compilers and libraries, both at compile time and at run time. To minimize the number of needed modules at runtime, use static linking to compile the applications.
Compilers
You can check the complete list of available compilers on MARCONI with the command:
...
In GPU-accelerated applications, the sequential part of the workload runs on the CPU – which is optimized for single-threaded performance – while the compute intensive portion of the application runs on thousands of GPU cores in parallel. When using CUDA, developers program in popular languages such as C, C++, Fortran, Python and MATLAB and express parallelism through extensions in the form of a few basic keywords. We refer to the the NVIDIA CUDA Parallel Computing Platform documentation.
...
Debugger and Profilers
If at runtime your code dies, then there is a problem. In order to solve it, you can decide to analyze the core file (core not available with PGI compilers) or to run your code using the debugger.
...
Other flags are compiler specific and are described in the following:
XL Fortran compiler
to be added...
PORTLAND Group (PGI) Compilers
The following flags are useful (in addition to "-O0 -g") for debugging your code:
-C                     Add array bounds checking
-Ktrap=ovf,divz,inv    Controls the behavior of the processor when exceptions occur:
                       FP overflow, divide by zero, invalid operands
GNU Fortran compilers
The following flags are useful (in addition to "-O0 -g")for debugging your code:
-Wall             Enables warnings pertaining to usage that should be avoided
-fbounds-check    Checks for array subscripts.
Debuggers available
Totalview
The TotalView debugger is a programmable tool that lets you debug, analyze, and tune the performance of complex serial, multiprocessor, and multithreaded programs.
TotalView has many features and it gives you a great number of tools for finding your program's problems.
...
pgdbg is the Portland Group Inc. symbolic source-level debugger for F77, F90, C, C++ and assembly language programs. It is capable of debugging applications that exhibit various levels of parallelism.
GNU: gdb (serial debugger)
GDB is the GNU Project debugger and allows you to see what is going on 'inside' your program while it executes -- or what the program was doing at the moment it crashed.
...
Valgrind is Open Source / Free Software, and is freely available under the GNU General Public License, version 2.
Profilers (gprof)
In software engineering, profiling is the investigation of a program's behavior using information gathered as the program executes. The usual purpose of this analisys is to determine which sections of a program to optimize - to increase its overall speed, decrease its memory requirement or sometimes both.
A (code) profiler is a performance analisys tool that, most commonly, measures only the frequency and duration of function calls, but there are other specific types of profilers (e.g. memory profilers) in addition to more comprehensive profilers, capable of gathering extensive performance data.
gprof
The GNU profiler gprof is a useful tool for measuring the performance of a program. It records the number of calls to each function and the amount of time spent there, on a per-function basis. Functions which consume a large fraction of the run-time can be identified easily from the output of gprof. Efforts to speed up a program should concentrate first on those functions which dominate the total run-time.
...
If the environmental variable is not set every task will write the same gmon.out file.
Scientific libraries
Engineering and Scientific Subroutine Library (ESSL)
Scientific libraries designed for Power architecture included in the XL compiler package,
...