| Table of Contents | ||
|---|---|---|
|
...
hostname: login.m100.cineca.it
...
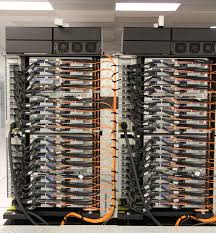
Architecture: IBM Power 9 AC922
Internal Network: Mellanox Infiniband EDR DragonFly+ 100 Gb/s
Storage: 8 PB (raw) GPFS of local storage
...
Model: IBM Power AC922 (Whiterspoon) Racks: 55 total (49 compute) |
|
|---|
...
> login01-ext.m100.cineca.it
> login02-ext.m100.cineca.it
> login03-ext.m100.cineca.it
For information about data transfer from other computers please follow the instructions and caveats on the dedicated section Data storage or the document Data Management.
...
Since all the filesystems are based on IBM Spectrum Scale™ file system (formerly GPFS), the usual unix command "quota" is not working. Use the local command cindata to query for disk usage and quota ("cindata -h" for help):
> cindata
Modules environment
The software modules are collected in different profiles and organized by functional categories (compilers, libraries, tools, applications,..). The profiles are of two types: “programming” type (base and advanced) for compilation, debugging and profiling activities, and “domain” type (chem-phys, lifesc,..) for the production activity. They can be loaded together.
"Base" profile is the default. It is automatically loaded after login and it contains basic modules for the programming activities (ibm, gnu, pgi, cuda compilers, math libraries, profiling and debugging tools,..).
If you want to use a module placed under other profiles, for example an application module, you will have to load preventively the corresponding profile:
>module load profile/<profile name>
>module load autoload <module name>
For listing all profiles you have loaded you can use the following command:
>module listIn order to detect all profiles, categories and modules available on MARCONI100 the command “modmap” is available. With modmap you can see if the desired module is available and which profile you have to load to use it.
>modmap -m <module_name>Spack environment
In case you don't find a software you are interested in, you can install it by yourself.
In this case, on Marconi100 we also offer the possibility to use the “spack” environment by loading the corresponding module. Please refer to the dedicated section in UG2.6: Production Environment
GPU and intra/inter connection environment
Marconi100 consists of 980 compute nodes and 8 login nodes, connected with a Mellanox Infiniband EDR network arranged into an architecture called DragonFly ++.
The login nodes and the compute nodes are exactly the same. Each node consists in 2 Power9 sockets, each of them with 16 cores and 2 Volta GPUs (32 cores and 4 GPUs per node). The multi-threading is active with 4 threads per physical core (128 total threads – or logical cpus – per node).

Due to how the hardware is detected on a Power9 architecture, the numbering of (logical) cpus follows the order of threading. You can get it with the ppc64_cpu command:
$ ppc64_cpu --infoCore 0: 0* 1* 2* 3*
Core 1: 4* 5* 6* 7*
Core 2: 8* 9* 10* 11*
Core 3: 12* 13* 14* 15*
...... (Cores from 4 to 28)........
Core 29: 116* 117* 118* 119*
Core 30: 120* 121* 122* 123*
Core 31: 124* 125* 126* 127*
The topology of the node can be visualized by running the command nvidia-smi as follows:
$ nvidia-smi topo -mDedicated node for Data transfer
A time limit of 10 cpu-minutes for processes running on login nodes has been set.
For Data transfer that may require more time, we set up a dedicated "data" VM accessible with a dedicated alias.
Login via ssh to this VM is not allowed. Environment variables as $HOME or $WORK are not defined, so you always have to explicitate the complete path to the files you need to copy.
For example to copy data to M100 using rsync you can run the following command:
rsync -PravzHS </data_path_from/file> <your_username>@data.m100.cineca.it:<complete_data_path_to>You can also use the "data" VM onto login nodes to move data from Marconi100 to another location with public IP:
ssh -xt data.m100.cineca.it rsync -PravzHS <complete_data_path_from/file> </data_path_to> this command will open a session on the VM that will not be closed until the rsync command is completed.
In similar ways you can use also scp and sftp commands if you prefer them.
Modules environment
The software modules are collected in different profiles and organized by functional categories (compilers, libraries, tools, applications,..). The profiles are of two types: “programming” type (base and advanced) for compilation, debugging and profiling activities, and “domain” type (chem-phys, lifesc,..) for the production activity. They can be loaded together.
"Base" profile is the default. It is automatically loaded after login and it contains basic modules for the programming activities (ibm, gnu, pgi, cuda compilers, math libraries, profiling and debugging tools,..).
If you want to use a module placed under other profiles, for example an application module, you will have to load preventively the corresponding profile:
>module load profile/<profile name>
>module load autoload <module name>
For listing all profiles you have loaded you can use the following command:
>module listIn order to detect all profiles, categories and modules available on MARCONI100 the command “modmap” is available. With modmap you can see if the desired module is available and which profile you have to load to use it.
>modmap -m <module_name>Spack environment
In case you don't find a software you are interested in, you can install it by yourself.
In this case, on Marconi100 we also offer the possibility to use the “spack” environment by loading the corresponding module. Please refer to the dedicated section in UG2.6: Production Environment
GPU and intra/inter connection environment
Marconi100 consists of 980 compute nodes and 8 login nodes, connected with a Mellanox Infiniband EDR network arranged into an architecture called DragonFly ++.
The login nodes and the compute nodes are exactly the same. Each node consists in 2 Power9 sockets, each of them with 16 cores and 2 Volta GPUs (32 cores and 4 GPUs per node). The multi-threading is active with 4 threads per physical core (128 total threads – or logical cpus – per node).
Due to how the hardware is detected on a Power9 architecture, the numbering of (logical) cpus follows the order of threading. You can get it with the ppc64_cpu command:
$ ppc64_cpu --infoCore 0: 0* 1* 2* 3*
Core 1: 4* 5* 6* 7*
Core 2: 8* 9* 10* 11*
Core 3: 12* 13* 14* 15*
...... (Cores from 4 to 28)........
Core 29: 116* 117* 118* 119*
Core 30: 120* 121* 122* 123*
Core 31: 124* 125* 126* 127*
The topology of the node can be visualized by running the command nvidia-smi as follows:
$ nvidia-smi topo -mGPU0 GPU1 GPU2 GPU3 CPU Affinity
GPU0 GPU0 GPU1 GPU2 GPU3 CPU Affinity
GPU0 X NV3 SYS SYS 0-63
GPU1 NV3 X SYS SYS 0-63
GPU2 SYS SYS X NV3 64-127
GPU3 SYS SYS SYS 0-63
GPU1 NV3 X 64-127SYS SYS 0-63
GPU2 SYS SYS X NV3 64-127
GPU3 SYS SYS NV3 X 64-127
From the output of the command From the output of the command it is possible to see that GPU0 and GPU1 are connected with the NVLink (NV3), as well as the couple GPU2 & GPU3. The first couple is connected to (virtual) cpus 0-63 (on the first socket), the second to (virtual) cpus 64-127 (on the second socket). The cpus are numbered from 0 to 127 because of a hyperthreading. The two Power9 sockets are connected by a 64 GBps X bus. Each of them is connected with 2 GPUs via NVLink 2.0.
...
The internode communications is based on a Mellanox Infiniband EDR network 100 Gb/s, and the OpenMPI and IBM MPI Spectrum libraries are configured so to exploit the Mellanox Fabric Collective Accelerators (also on CUDA memories) and Messaging Accelerators.
...
In the following table you can find the main features and limits imposed on the partitions of M100.
Note: core refers to a physical cpu, with its 4 HTs; cpu refers to a logical cpu (1 HT). Each node has 32 cores/128 cpus.
SLURM partition | Job QOS | # cores/# GPU per job | max walltime | max running jobs per user/ max n. of |
cores/nodes/GPUs per user | priority | notes |
m100_all_serial |
default) | normal | max = 1 core, max mem= 7600MB | 04:00:00 | 4 cpus/1 GPU | 40 |
| qos_ |
| install | max = |
| 16 cores |
| 04:00:00 |
| max = 16 cores 1 job per user | 40 | request to superc@cineca.it | ||||
m100_usr_prod | normal | max = 16 nodes | 24:00:00 | 40 | runs on 880 nodes | |
| m100_qos_ |
| dbg | max = |
| 2 nodes |
| 02:00:00 |
| 2 nodes/64cores/8GPUs |
| 80 | runs on |
| 12 nodes |
| m100_ |
| qos_ |
| bprod | min = 17 nodes max = |
256 nodes | 24:00:00 | 256 nodes |
| 60 | runs on |
512 nodes |
m100_fua_prod
(EUROFUSIONmin is 17 FULL nodes (544 cores, 2176 cpus) |
| m100_ |
| usr_ |
| preempt | normal | max = |
| 16 nodes |
| 24:00:00 |
| 1 | runs on |
99 nodes | ||||||
m100_fua_prod (EUROFUSION) | normal | max = 16 nodes | 24:00:00 | 40 | runs on |
87 nodes | ||||||
| m100_qos_fuadbg | max = 2 nodes | 02:00:00 | 45 | runs on 12 nodes | ||
| m100_qos_fuabprod | min = 17 nodes max = 32 nodes | 24:00:00 | 40 | run on 64 nodes at same time | ||
| all partitions | qos_special | > 32 nodes | > 24:00:00 | 40 | request to superc@cineca.it | |
all partitions | qos_lowprio | max = 16 nodes | 24:00:00 | 0 | active projects with exhausted budget request to superc@cineca.it |
The partition m100_usr_preempt allows users to access the additional nodes of m100_fua_prod partition in preemptable modality (if available and not used by Eurofusion community). The jobs submitted to the m100_usr_preempt partition may be killed if the assigned resources are requested by jobs submitted to higher priority partition (m100_fua_prod); hence we recommend its use only with restartable applications.
Users with exhausted but still active projects are allowed to keep using the cluster resources, even if at a very low priority, by adding the "qos_lowprio" flag to their job:
#SBATCH --qos=qos_lowprio
This qos is not active for EUROFusion projects for which a different dedicated QOS (qos_fualowprio) is automatically associated to Eurofusion users once their projects exhaust the budget before their expiry date.
For all the other users, please ask superc@cineca.it the QOS association.
Eurofusion users can also use the computing resources at low priority before their budget gets exhausted, in case they wish to run non urgent jobs without consuming the budget of the granted project. Please ask superc@cineca.it to be added to the Account FUAC5FUAC6_LOWPRIO, and specify this account and the qos_lowprio fualowprio QOS in your submission script.
...
In this way each tasks will correspond to one (physical) core.
Submitting serial batch jobs
The m100_all_serial partition is available with a maximum walltime of 4 hours, 1 core and 7600 MB per job. It runs on two dedicated nodes (equipped with 4 Volta GPUs), and it is designed for pre/post-processing serial analysis (using or not the GPUs), for moving your data (via rsync, scp etc.), and for programming tools.
#SBATCH -p m100_all_serial
This is the default partition, the use of this partition is free of charge and available to all users on the cluster.
Submitting batch jobs for production
Not all of the partitions are open to access by the academic community as some are reserved to dedicated classes of users (for example m100_fua_ * partitions are for EUROfusion users):
M100 GPU use report
A statistics of the GPU utilization during a job, provided by nvidia dcgmi tool, can be obtained at the end of the job by explicitly requesting the constraing "gpureport":
#SBATCH --constraint=gpureport (or -C gpureport)
This option will result, at the end of the job, in producing a file for each of the nodes assigned to the job with the relevant information on the employed GPUs (performance statistics, such as Energy Consumed, Power Usage, Max GPU Memory Used, GPU and Memory Used etc.; Event Stats, as ECC Errors etc.; Slowdown Stats; Overall Health). The files are named "dcgmi_stats_<node_name>_<jobid>.out".
Submitting serial batch jobs
The m100_all_serial partition is available with a maximum walltime of 4 hours, 1 core and 7600 MB per job. It runs on two dedicated nodes (equipped with 4 Volta GPUs), and it is designed for pre/post-processing serial analysis (using or not the GPUs), for moving your data (via rsync, scp etc.), and for programming tools.
#SBATCH -p m100_all_serial
This is the default partition, the use of this partition is free of charge and available to all users on the cluster.
Submitting batch jobs for production
Not all of the partitions are open to access by the academic community as some are reserved to dedicated classes of users (for example m100_fua_ * partitions are for EUROfusion users):
m100_fua_* partitions are reserved to EUROFusion users
m100_usr_* partitions are open to academic production
m100_fua_* partitions are reserved to EuroFusion users
m100_usr_* partitions are open to academic production.
In these partitions you can use also the QOS directives, in order to modulate your request:
...
16 full cores are requested and 2 GPUs. The 16x4 (virtual) cpus are used for 4 MPI tasks and 16 OMP threads per task. The -m flag in the srun command specifies the desired process distribution between nodes/socket/cores (the default is block:cyclic). Please refer to srun manual for more details on the processes distribution and binding. The --map-by socket:PE=4 will assign and bind 4 physical consecutive cores to each process (see process mapping and binding on the official IBM Spectrum MPI manual).
> salloc -N1 --ntasks-per-node=32 --cpus-per-task=4 --gres=gpu:2 --partition=...
...
Here you can find Other batch job examples on M100 .
Graphic session
You can find more information on process mapping and binding on the official IBM Spectrum MPI manual.
Graphic session
If If a graphic session is desired we recommend to use the tool RCM (Remote Connection Manager). For additional information visit Remote Visualization section on our User Guide.
...
and checking the "compilers" section. The available compilers are:
- XL
- NVIDIA HPC-SDK (ex PGI)
- GNU
- CUDA
XL
The XL compiler family offers C, C++, and Fortran compilers designed for optimization and improvement of code generation, exploiting the inherent opportunities in Power Architecture. This is the recommended sofware stack on M100, together with Spectrum-MPI parallel library and ESSL scientific library.
...
| Invocations | Usage |
|---|---|
| pgcc | Compile C source files. |
| pgccpgc++ | Compile C++ source files. |
| pgf77 | Compile FORTRAN 77 source files |
| pgf90 | Compile FORTRAN 90 source files |
| pgf95 | Compile FORTRAN 95 source files |
...
Valgrind is a framework for building dynamic analysis tools. There are Valgrind tools that can automatically detect many memory management and threading bugs, and profile your programs in detail. The Valgrind distribution currently includes six production-quality tools: a memory error detector, two thread error detectors, a cache and branch-prediction profiler, a call-graph generating cache profiler, and a heap profiler.
Valgrind is Open Source / Free Software, and is freely available under the GNU General Public License, version 2.
Profilers (gprof)
In software engineering, profiling is the investigation of a program's behavior using information gathered as the program executes. The usual purpose of this analysis is to determine which sections of a program to optimize - to increase its overall speed, decrease its memory requirement or sometimes both.
A (code) profiler is a performance analysis tool that, most commonly, measures only the frequency and duration of function calls, but there are other specific types of profilers (e.g. memory profilers) in addition to more comprehensive profilers, capable of gathering extensive performance data.
gprof
The GNU profiler gprof is a useful tool for measuring the performance of a program. It records the number of calls to each function and the amount of time spent there, on a per-function basis. Functions which consume a large fraction of the run-time can be identified easily from the output of gprof. Efforts to speed up a program should concentrate first on those functions which dominate the total run-time.
gprof uses data collected by the -pg compiler flag to construct a text display of the functions within your application (call tree and CPU time spent in every subroutine). It also provides quick access to the profiled data, which let you identify the functions that are the most CPU-intensive. The text display also lets you manipulate the display in order to focus on the application's critical areas.
Usage:
>  gfortran -pg -O3 -o myexec myprog.f90
> ./myexec
> ls -ltr
   .......
   -rw-r--r-- 1 aer0 cineca-staff    506 Apr  6 15:33 gmon.out
> gprof myexec gmon.out
It is also possible to profile at code line-level (see "man gprof" for other options). In this case, you must use also the “-g” flag at compilation time:
>  gfortran -pg -g -O3 -o myexec myprog.f90
> ./myexec
> ls -ltr
   .......
   -rw-r--r-- 1 aer0 cineca-staff    506 Apr  6 15:33 gmon.out
> gprof -annotated-source myexec gmon.out
It is possible to profile MPI programs. In this case, the environment variable GMON_OUT_PREFIX must be defined in order to allow to each task to write a different statistical file. Setting
export GMON_OUT_PREFIX=<name>once the run is finished each task will create a file with its process ID (PID) extension
<name>.$PIDincludes six production-quality tools: a memory error detector, two thread error detectors, a cache and branch-prediction profiler, a call-graph generating cache profiler, and a heap profiler.
Valgrind is Open Source / Free Software, and is freely available under the GNU General Public License, version 2.
Profilers (gprof)
In software engineering, profiling is the investigation of a program's behavior using information gathered as the program executes. The usual purpose of this analysis is to determine which sections of a program to optimize - to increase its overall speed, decrease its memory requirement or sometimes both.
A (code) profiler is a performance analysis tool that, most commonly, measures only the frequency and duration of function calls, but there are other specific types of profilers (e.g. memory profilers) in addition to more comprehensive profilers, capable of gathering extensive performance data.
gprof
The GNU profiler gprof is a useful tool for measuring the performance of a program. It records the number of calls to each function and the amount of time spent there, on a per-function basis. Functions which consume a large fraction of the run-time can be identified easily from the output of gprof. Efforts to speed up a program should concentrate first on those functions which dominate the total run-time.
gprof uses data collected by the -pg compiler flag to construct a text display of the functions within your application (call tree and CPU time spent in every subroutine). It also provides quick access to the profiled data, which let you identify the functions that are the most CPU-intensive. The text display also lets you manipulate the display in order to focus on the application's critical areas.
Usage:
>  gfortran -pg -O3 -o myexec myprog.f90
> ./myexec
> ls -ltr
   .......
   -rw-r--r-- 1 aer0 cineca-staff    506 Apr  6 15:33 gmon.out
> gprof myexec gmon.out
It is also possible to profile at code line-level (see "man gprof" for other options). In this case, you must use also the “-g” flag at compilation time:
>  gfortran -pg -g -O3 -o myexec myprog.f90
> ./myexec
> ls -ltr
   .......
   -rw-r--r-- 1 aer0 cineca-staff    506 Apr  6 15:33 gmon.out
> gprof -annotated-source myexec gmon.out
It is possible to profile MPI programs. In this case, the environment variable GMON_OUT_PREFIX must be defined in order to allow to each task to write a different statistical file. Setting
export GMON_OUT_PREFIX=<name>once the run is finished each task will create a file with its process ID (PID) extension
<name>.$PIDIf the environmental variable is not set every task will write the same gmon.out file.
GPU profilers (Nvidia Nsight System)
Nvidia Nsight System is a system-wide performance analysis tool designed to visualize an application’s algorithms, help you identify the largest opportunities to optimize, and tune to scale efficiently across any quantity or size of CPUs and GPUs; from large server to our smallest SoC.
You can find general info on how to use it in the dedicated Nvidia User Guide pages.
On Marconi100 only the Command Line Interface (CLI) is available since the GUI does not support Power9 nodes. Our suggestion is to run the CLI inside your job script in order to generate the qdrep files. Then you can download the qdrep files on your local PC and visualize them with the Nsight System GUI available on your workstation.
The profiler is available under the modules hpc-sdk, cuda/11.0 and later versions.
Standard usage of an MPI job running on GPU is
> mpirun <options> nsys profile -o ${PWD}/output_%q{OMPI_COMM_WORLD_RANK} -f true --stats=true --cuda-memory-usage=true <your_code> <input> <output>On the single node you can also run the profiler as "nsys profile mpirun", but keep in mind that with this syntax nsys will put everything in a single report.
Unfortunately nsys usually generates several files in /tmp dir of the compute node even if a TMPDIR environment variable is set. These files may be big causing the filling of the /tmp folder and, as a consequence, the crash of the compute node and the failure of the job.
In order to avoid such a problem we strongly suggest to include in your sbatch script the following lines around your mpirun call as a workaround:
> rm -rf /tmp/nvidia
> ln -s $TMPDIR /tmp/nvidia
> mpirun ... nsys profile .....
> rm -rf /tmp/nvidia
This will place the temporary outputs of the nsys code in your TMPDIR folder that by default is /scratch_local/slurm_job.$SLURM_JOB_ID where you have 1 TB of free space.
This workaround may cause conflicts between multiple jobs running this profiler on a compute node at the same time, so we strongly suggest also to request the compute node exclusively:
#SBATCH --exclusiveNsight Systems can also collect kernel IP samples and backtraces, however, this is prevented by the perf event paranoid level being set to 2 on Marconi100. It is possible to bypass this restriction by adding the SLURM directive:
#SBATCH --gres=sysfsAlong with the exclusive one. If the environmental variable is not set every task will write the same gmon.out file.
MPI environment
We offer two options for MPI environment on Marconi100:
...
Here you can find some useful details on how to use them on Marconi100.
Warning: When you compile your code using the XL compiler with Spectrum-MPI parallel library (our recommended software stack) you have to use mpirun (not srun) to execute your program.
Spectrum-MPI
It is an IBM implementation of MPI. Together with XL compiler it is the recommended enviroment to be used on Marconi100.
In addition to OpenMPI it adds unique features optimized for IBM systems such as CPU affinity features, dynamic selection of interface libraries, workload manager integrations and better performance.
Spectrum-MPI supports both CUDA-aware and GPUDirect technologies.
...