Table of Contents maxLevel 3
...
start of production (A3+ - Skylake): 23/01/2018
...
Marconi is the new Tier-0 system, co-designed by Cineca and based on the Lenovo NeXtScale platform, that substitutes the former IBM BG/Q system (FERMI). MARCONI, based on the next-generation of the Intel® Xeon Phi™ product family alongside with Intel® Xeon® processor E5-2600 v4 product family, offers the scientific community a technologically advanced and energy-efficient high performance computing system.
...
Login nodes: 8 Login (3 available for regular users). Each one contains 2 x Intel Xeon Processor E5-2697 v4 with a clock of 2.30GHz and 128 GB of memory. Login nodes are shared between three partitions: A1 (BDW), A2 (KNL) and A3 (SKL). The three partitions are served by a single SLURM server.
System A1 (Broadwell) Model: Lenovo NeXtScale Racks: 10
|
|
|---|

System A2 (Knights Landing) Model: Lenovo Adam Pass Racks: 50 Peak Performance: 11 PFlop/s |
|---|
System A3 (Skylake) Model: Lenovo Stark Racks: 21 |
 |
|---|
...
Marconi Network
Network type: new Intel Omnipath, 100 Gb/s. MARCONI is the largest Omnipath cluster of the world.
Network topology: Fat-tree 2:1 oversubscription tapering at the level of the core switches only.
Core Switches: 5 x OPA Core Switch "Sawtooth Forest", 768 ports each.
Edge Switch: 216 OPA Edge Switch "Eldorado Forest", 48 ports each.
Maximum system configuration: 5(opa) x 768 (ports) x 2 (tapering) → 7680 servers.
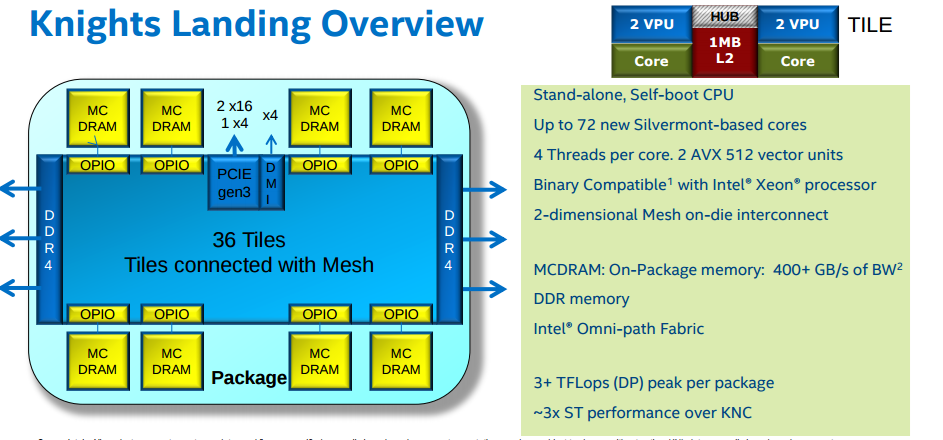
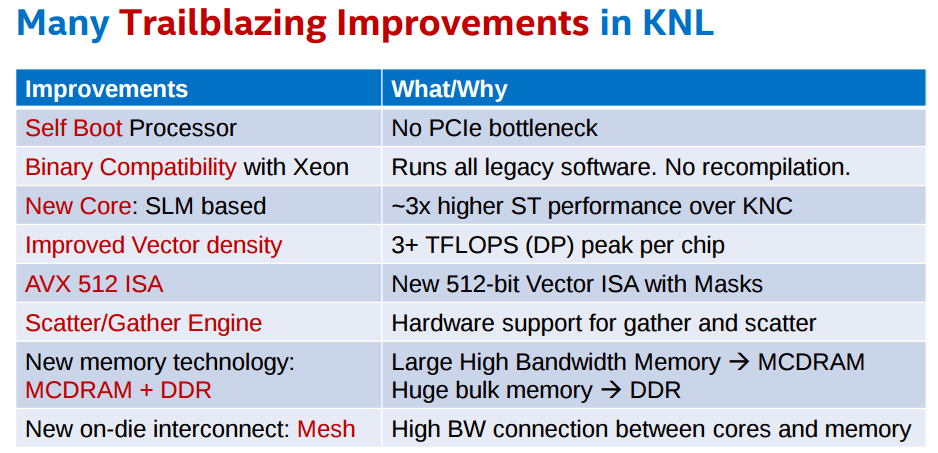
KNL is the evolution of Knights Corner (KNC), available on GALILEO until January 2018. The main differences between KNC and KNL are:
...
Storage devices are in common between the two partitions.
This supercomputer is available to European researchers as a Tier-0 system of the PRACE (www.prace-project.eu) infrastructure, as well as to Italian public and industrial researchers.
Part of this system (MARCONI_Fusion) is reserved for the activity of EUROfusion (https://www.euro-fusion.org/). Details on the MARCONI_Fusion environment are reported in a dedicated document.
Access
All the login nodes have an identical environment and can be reached with SSH (Secure Shell) protocol using the "collective" hostname:
...
A $WORK area is defined for each active project on the system, reserved for all the collaborators of the project. This is a safe storage area to keep run time data for the whole life of the project.
| Total Dimension (TB) | Quota (GB) | Notes | ||
|---|---|---|---|---|
| $HOME | 200 | 50 |
| |
| $CINECA_SCRATCH | 2.500 | no quota |
| |
| $WORK | 7.100 | 1.000 |
|
$DRES environment variable points to the shared repository where Data RESources are maintained. This is a data archive area available only on-request, shared with all CINECA HPC systems and among different projects. $DRES is not mounted on the compute nodes. This means that you cannot access it within a batch job: all data needed during the batch execution has to be moved to $WORK or $CINECA_SCRATCH before the run starts.
...
MARCONI Partition | SLURM partition | QOS | # cores per job | max walltime | max running jobs per user/ max n. of cpus/nodes per user | max memory per node (MB) | priority | HBM/clustering mode | notes | |||||||||||||
front-end | bdw_all_serial (default partition) | noQOS | max = 6 (max mem= 18000 MB) | 04:00:00 | 6 cpus
| 18000 | 40 | |||||||||||||||
| A1 | qos_rcm | min = 1 max = 48 | 03:00:00 | 1/48 | 182000 | - | runs on 24 nodes shared with the debug queue on SKL | |||||||||||||||
| A2 | knl_usr_dbg | no QOS | min = 1 node max = 2 nodes | 00:30:00 | 5/5 | 86000 (cache) | 40 | runs on 144 dedicated nodes | ||||||||||||||
| A2 | knl_usr_prod | no QOS | min = 1 node max = 195 nodes | 24:00:00 | 1000 nodes | 86000 (cache) | 40 | |||||||||||||||
| knl_qos_bprod | min = 196 nodes max = 1024 nodes | 24:00:00 | 1/1000 | 86000 (cache) | 85 | #SBATCH -p knl_usr_prod #SBATCH --qos=knl_qos_bprod | ||||||||||||||||
| A3 | skl_usr_dbg | no QOS | min = 1 node max = 4 nodes | 00:30:00 | 4/4 | 182000 | 40 | runs on 24 dedicated nodes | ||||||||||||||
| A3 | skl_usr_prod | no QOS | min = 1 node max = 64 nodes | 24:00:00 | 64 nodes | 182000 | 40 | |||||||||||||||
| skl_qos_bprod | min=65 max = 171256 | 24:00:00 | 1/171 1 jobs per account | 182000 | 85 | #SBATCH -p skl_usr_prod #SBATCH --qos=skl_qos_bprod |
...
Other flags are available for specific compilers and are reported later.
INTEL Compilers
Initialize the environment with the module command:
...
-extend_source    Extend over the 77 column F77's limit
-free / -fixed    Free/Fixed form for Fortran
-ip               Enables interprocedural optimization for single-file compilation
-ipo              Enables interprocedural optimization between files - whole program optimisation
...
Compiling for KNL and SKL
...
How to Improve Code Vectorization
PORTLAND Group (PGI)
Initialize the environment with the module command:
...
-ffixed-line-length-132       To extend over the 77 column F77's limit
-ffree-form / -ffixed-form    Free/Fixed form for Fortran
...
GNU compilers
The gnu compilers are always available but they are not the best optimizing compilers. You do not need to load the module for using them.
...
If at runtime your code dies, then there is a problem. In order to solve it, you can decide to analyze the core file (core not available with PGI compilers) or to run your code using the debugger.
Compiler flags
Whatever your decision, in any case you need to enable compiler runtime checks, by putting specific flags during the compilation phase. In the following we describe those flags for the different Fortran compilers: if you are using the C or C++ compiler, please check before because the flags may differ.
The following flags are generally available for all compilers and are mandatory for an easier debugging session:
-O0     Lower level of optimization
-g      Produce debugging information
Other flags are compiler specific and are described in the following:
INTEL Fortran compiler
The following flags are useful (in addition to "-O0 -g") for debugging your code:
-traceback        generate extra information to provide source file traceback at run time
-fp-stack-check   generate extra code to ensure that the floating-point stack is in the expected state
-check bounds     enables checking for array subscript expressions
-fpe0             allows some control over floating-point exception handling at run-time
PORTLAND Group (PGI) Compilers
The following flags are useful (in addition to "-O0 -g") for debugging your code:
-C                     Add array bounds checking
-Ktrap=ovf,divz,inv    Controls the behavior of the processor when exceptions occur:
                       FP overflow, divide by zero, invalid operands
GNU Fortran compilers
The following flags are useful (in addition to "-O0 -g")for debugging your code:
-Wall             Enables warnings pertaining to usage that should be avoided
-fbounds-check    Checks for array subscripts.
Debuggers available
Totalview
NOTE: if debugging with Intel compiler suite, you may want to add in your jobscript the following line, before the execution of TotalView:
source $INTELMPI_HOME/bin64/mpivars.sh debug
to provide a better population of the message queue.
Scalasca
....
In the following we report information about other ways to debug your codes:
PGI: pgdbg (serial/parallel debugger)
pgdbg is the Portland Group Inc. symbolic source-level debugger for F77, F90, C, C++ and assembly language programs. It is capable of debugging applications that exhibit various levels of parallelism, including:
- Single-thread, serial applications
- Multi-threaded applications
- Distributed MPI applications
- Any combination of the above
There are two forms of the command used to invoke pgdbg. The first is used when debugging non-MPI applications, the second form, using mpirun, is used when debugging MPI applications:
> pgdbg [options] ./myexec [args]
> mpirun [options] -dbg=pgdbg ./myexec [args]
More details in the on line documentation, using the "man pgdbg" command after loading the module.
To use this debugger, you should compile your code with one of the pgi compilers and the debugging command-line options described above, then you run your executable inside the "pgdbg" environment:
> module load pgi
> pgf90 -O0 -g -C -Ktrap=ovf,divz,inv  -o myexec myprog.f90
> pgdbg ./myexec
By default, pgdbg presents a graphical user interface (GUI). A command-line interface is also provided though the "-text" option.
GNU: gdb (serial debugger)
GDB is the GNU Project debugger and allows you to see what is going on 'inside' your program while it executes -- or what the program was doing at the moment it crashed.
GDB can do four main kinds of things (plus other things in support of these) to help you catch bugs in the act:
- Start your program, specifying anything that might affect its behavior.
- Make your program stop on specified conditions.
- Examine what has happened, when your program has stopped.
- Change things in your program, so you can experiment with correcting the effects of one bug and go on to learn about another.
More details in the on line documentation, using the "man gdb" command.
To use this debugger, you should compile your code with one of the gnu compilers and the debugging command-line options described above, then you run your executable inside the "gdb" environment:
> gfortran -O0 -g -Wall -fbounds-check -o myexec myprog.f90
> gdb ./myexec
VALGRIND
Valgrind is a framework for building dynamic analysis tools. There are Valgrind tools that can automatically detect many memory management and threading bugs, and profile your programs in detail. The Valgrind distribution currently includes six production-quality tools: a memory error detector, two thread error detectors, a cache and branch-prediction profiler, a call-graph generating cache profiler, and a heap profiler.
Valgrind is Open Source / Free Software, and is freely available under the GNU General Public License, version 2.
To analyze a serial application:
- Load Valgrind module --> module load valgrind
- Load module for the compiler and compile your code with the compiler you prefer (Use -O0 -g flags)
- Run the executable under Valgrind.
If you normally run your program like this:
myprog arg1 arg2
Use this command line:
valgrind (valgrind-options) myprog arg1 arg2
Memcheck is the default tool. You can add the --leak-check option that turns on the detailed memory leak detector. Your program will run much slower than normal, and use a lot more memory. Memcheck will issue messages about memory errors and leaks that it detects.
- Load Valgrind module --> module load valgrind
- Load modules for compiler and openmpi libraries (at present only available for intel and gnu)
- Compile your code with the "-O0 -g" flags both at compiling and linking time
- Run the executable under Valgrind (both in interactive than in bacth mode)
mpirun -np 4 valgrind (valgrind-options) myprog arg1 arg2
Core file analisys
In order to understand what problem was affecting you code, you can also try a "Core file" analisys. Since core files are usually quite large, be sure to work in the /scratch area.
There are several steps to follow:
- Increase the limit for possible core dumping
> ulimit -c unlimited (bash)
> limit coredumpsize unlimited (csh/tcsh)
- If you are using Intel compilers, set to TRUE the decfort_dump_flag environment variable
> export decfort_dump_flag=TRUE  (bash)
> setenv decfort_dump_flag TRUE  (csh/tcsh)
- Compile your code with the debug flags described above.
- Run your code and create the core file.
- Analyze the core file using different tools depending on the original compiler.
INTEL compilers
> module load intel
> ifort -O0 -g -traceback -fp-stack-check -check bounds -fpe0 -o myexec prog.f90
> ulimit -c unlimited
> export decfort_dump_flag=TRUE
> ./myexec
> ls -lrt
  -rwxr-xr-x 1 aer0 cineca-staff   9652 Apr  6 14:34 myexec
  -rw------- 1 aer0 cineca-staff 319488 Apr  6 14:35 core.25629
> idbc ./myexec core.25629
PGI compilers
> module load pgi
> pgf90 -O0 -g -C -Ktrap=ovf,divz,inv  -o myexec myprog.f90
> ulimit -c unlimited
> ./myexec
> ls -lrt
  -rwxr-xr-x 1 aer0 cineca-staff   9652 Apr  6 14:34 myexec
  -rw------- 1 aer0 cineca-staff 319488 Apr  6 14:35 core.25666
> pgdbg -text -core core.25666 ./myexec
GNU Compilers
> gfortran -O0 -g -Wall -fbounds-check -o myexec prog.f90
> ulimit -c unlimited
> ./myexec
> ls -lrt
  -rwxr-xr-x 1 aer0 cineca-staff   9652 Apr  6 14:34 myexec
  -rw------- 1 aer0 cineca-staff 319488 Apr  6 14:35 core.25555
> gdb ./myexec core.2555
Profilers (gprof)
In software engineering, profiling is the investigation of a program's behavior using information gathered as the program executes. The usual purpose of this analisys is to determine which sections of a program to optimize - to increase its overall speed, decrease its memory requirement or sometimes both.
A (code) profiler is a performance analisys tool that, most commonly, measures only the frequency and duration of function calls, but there are other specific types of profilers (e.g. memory profilers) in addition to more comprehensive profilers, capable of gathering extensive performance data.
gprof
The GNU profiler gprof is a useful tool for measuring the performance of a program. It records the number of calls to each function and the amount of time spent there, on a per-function basis. Functions which consume a large fraction of the run-time can be identified easily from the output of gprof. Efforts to speed up a program should concentrate first on those functions which dominate the total run-time.
gprof uses data collected by the -pg compiler flag to construct a text display of the functions within your application (call tree and CPU time spent in every subroutine). It also provides quick access to the profiled data, which let you identify the functions that are the most CPU-intensive. The text display also lets you manipulate the display in order to focus on the application's critical areas.
Usage:
>  gfortran -pg -O3 -o myexec myprog.f90
> ./myexec
> ls -ltr
   .......
   -rw-r--r-- 1 aer0 cineca-staff    506 Apr  6 15:33 gmon.out
> gprof myexec gmon.out
It is also possible to profile at code line-level (see "man gprof" for other options). In this case you must use also the “-g” flag at compilation time:
>  gfortran -pg -g -O3 -o myexec myprog.f90
> ./myexec
> ls -ltr
   .......
   -rw-r--r-- 1 aer0 cineca-staff    506 Apr  6 15:33 gmon.out
> gprof -annotated-source myexec gmon.out
It is possilbe to profile MPI programs. In this case the environment variable GMON_OUT_PREFIX must be defined in order to allow to each task to write a different statistical file. Setting
export GMON_OUT_PREFIX=<name>
once the run is finished each task will create a file with its process ID (PID) extension
<name>.$PID
If the environmental variable is not set every task will write the same gmon.out file.
Intel VTUNE Amplifier
Intel performance analisys toolkit that can be used to identify bottlenecks in an application. The tool can be used to perform different types of analisys.
To start the analisys use the command line interface:
module load autoload vtune
amplxe-cl -collect hotspots -r <application_path> <vtune_options> <application>
To explore the results of the analisys performed use the Intel VTune Amplifier GUI:
amplxe-gui <application_path>
Please note that to get a correct result in terms of CPU time it is suggested to use of the advanced-hotspots analisys on both Marconi KNL and SKL partitions. For example:
amplxe-cl -collect advanced-hotspots --target-duration-type veryshort <executable>
Scientific libraries
MKL
The Intel Math Kernel Library (Intel MKL) enables improving performance of scientific, engineering, and financial software that solves large computational problems. Intel MKL provides a set of linear algebra routines, fast Fourier transforms, as well as vectorized math and random number generation functions, all optimized for the latest Intel processors, including processors with multiple cores.
Intel MKL is thread-safe and extensively threaded using the OpenMP technology
documentation can be found in:
${MKLROOT}/../Documentation/en_US/mkl
To use the MKL in your code you to load the module, then to define includes and libraries at compile and linking time:
> module load mkl
> icc -I$MKL_INC -L$MKL_LIB  -lmkl_intel_lp64 -lmkl_core -lmkl_sequential
For more inormation please refer to the documentation.
Parallel programming
The parallel programming on MARCONI is based on IntelMPI and OpenMPI versions of MPI. The libraries and special wrappers to compile and link the personal programs are contained in several modules, one for each supported suite of compilers.
The main four parallel-MPI commands for compilation are:
- mpiifort (IntelMPI)/ mpif90 (OpenMPI) (Fortran90)
- mpiifort (IntelMPI) / mpif77 (OpenMPI) (Fortran77)
- mpiicc (IntelMPI) / mpicc (OpenMPI) (C)
- mpiicpc (IntelMPI) / mpicxx (C++)
These command names refers to wrappers around the actual compilers, they behave differently depending on the module you have loaded.
> module avail intelmpi
intelmpi/2017--binary(default) intelmpi/5.1--binary

> module load intel/pe-xe-2017--binary intelmpi/2017--binary
> man mpiifort
> mpiifort -o myexec myprof.f90 (uses the ifort compiler)
Please note that the Intel mpif90 wrapper is meant for using the GNU gfortran compiler instead of Intel ifort. If you need to use the IntelMPI libraries with the GNU gfortran compiler you need to redefine the I_MPI_F90 variable:
> module load autoload intelmpi/2017–binary
> export I_MPI_F90=gfortran
> mpif90 -o myexec myprof.f90 (uses the gfortran compiler)
With the above setting the system gfortran (4.8) compiler will be used. You can use a more recent version loading the gnu/6.1.0 module together with the intelmpi/2017–binary.
> module avail openmpi
openmpi/1-10.3--gnu--6.1.0
> module load gnu openmpi/1-10.3--gnu--6.1.0
> man mpif90
> mpif90 -o myexec myprof.f90 (uses the gfortran compiler)
The parallel applications have to be executed with the command:
> mpirun ./myexec
There are limitations on running parallel programs in the login shell. You should use the "Interactive SLURM" mode, as described in the "Interactive" section, previously in this page.
-Wall             Enables warnings pertaining to usage that should be avoided
-fbounds-check    Checks for array subscripts.